


Forest operations generate large volumes of information across harvesting, inventory, transportation, deliveries, and planning. Turning that data into clear, accessible insights is essential for understanding what is happening across the operation and making informed decisions.
Remsoft BI Reporting uses Microsoft Power BI to help forestry teams visualize operational and planning data through interactive reports. By connecting Remsoft data with flexible business intelligence tools, users can explore wood flow, destination inventory, delivery schedules, and optimization scenarios in formats that are easier to interpret and share.
This gives planners and business users a more accessible way to explore the information behind operational and planning decisions.
Key Takeaways
- Power BI reporting turns Remsoft operational and planning data into interactive visualizations.
- Reports can help teams track wood flow, inventory levels, deliveries, and optimization scenarios.
- Planned, forecast, and actual information can be viewed together to identify differences and emerging issues.
- Configurable reporting gives organizations more flexibility in how they explore and communicate forestry data.
- Clear data visualization helps planners and business users understand operational information without relying only on tables or spreadsheets.
The Journey to Enhanced BI Reporting
Business intelligence has long played a role in Remsoft Operations, with built-in dashboards helping users monitor operational performance.
The integration with Microsoft Power BI extends these reporting capabilities by providing greater flexibility in how data can be visualized, customized, and shared.
Power BI reports can connect with Remsoft data through available APIs and data queries. This allows organizations to develop reporting views around the information that matters most to their operation while continuing to use Remsoft as the source for planning and operational data.
Rather than relying on static reports, users can interact with visualizations, apply filters, drill into specific areas, and explore the information from different perspectives.
Key Benefits of BI Reporting
Remsoft BI Reporting can support several aspects of forestry planning and operations.
Better visibility: Bring operational data into clear visual reports that help teams understand current conditions and performance.
Interactive analysis: Filter and explore information by factors such as time, geography, products, units, destinations, or other available attributes.
Flexible reporting: Adapt Power BI templates or develop reports around specific planning and business requirements.
Easier communication: Present complex forestry data in a visual format that can be understood and shared across different teams.
Connected decision support: Use operational and optimization data to better understand the effects of planning decisions.
BI Reporting Applications in Forest Operations
Remsoft BI Reporting can be applied to several practical forest operations and planning workflows.
Wood Flow Analysis
Related: How AI and Machine Learning Improve Harvest Accuracy in Forestry Operations.
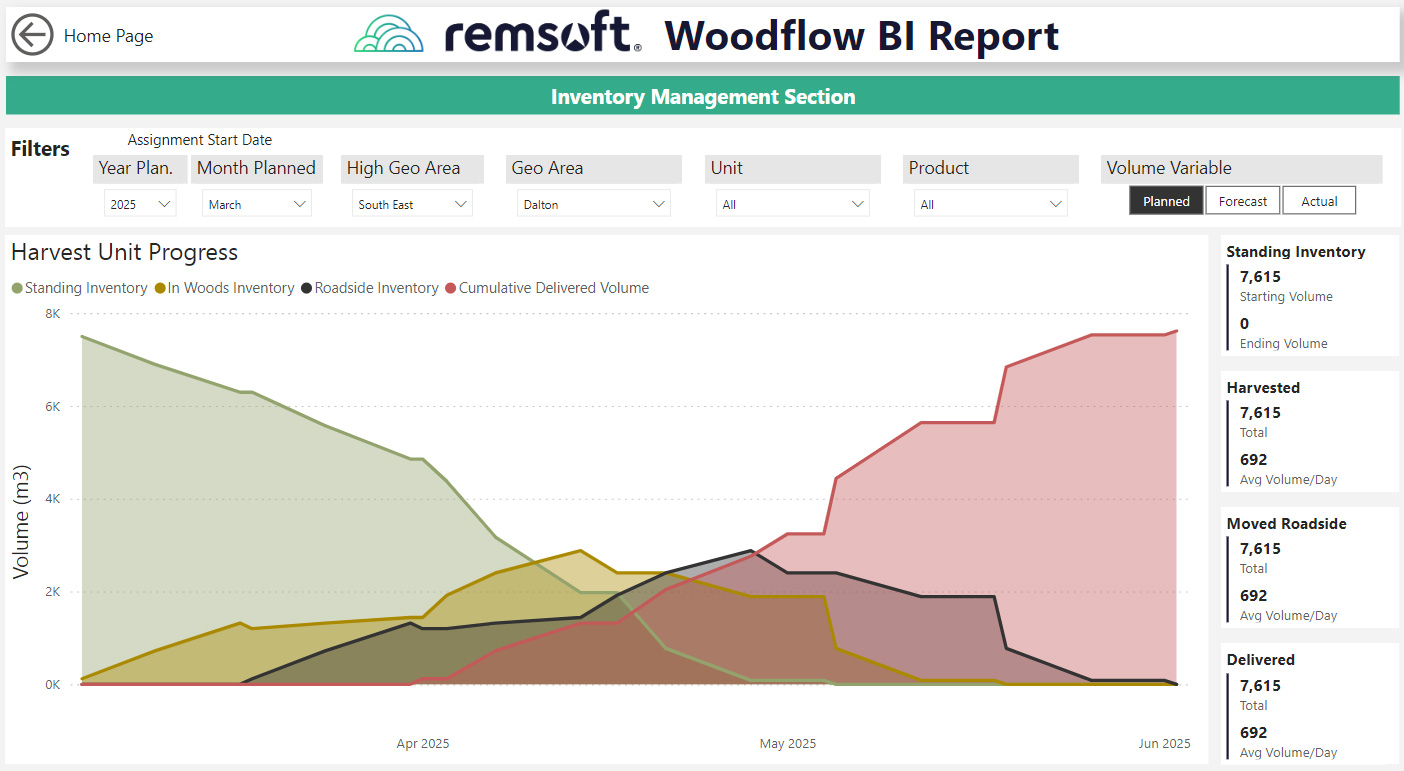
Understanding how wood moves from standing inventory through harvest and delivery is essential for maintaining supply and identifying potential differences from the plan.
The Wood Flow BI Report provides a visual view of volume as it progresses through the operation. Users can see standing inventory, in-woods inventory, roadside inventory, and cumulative delivered volume while comparing planned, forecast, and actual information.
Filters allow the report to be explored by planning period, geographic area, harvest unit, product, and other available attributes.
This gives planners a clearer picture of where volume is within the forest-to-mill process and where actual performance may be moving away from expectations.
Destination Summary
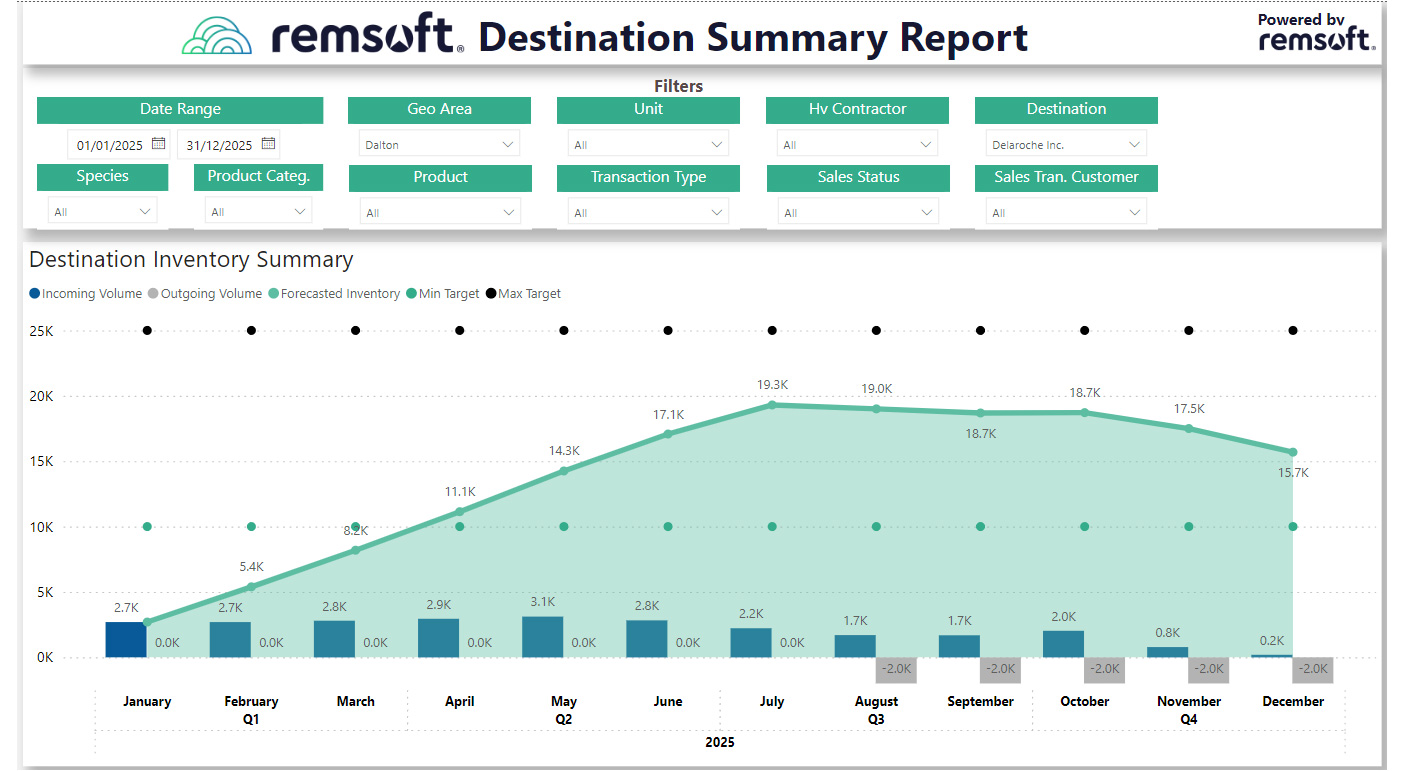
Maintaining appropriate inventory at a mill or other destination requires visibility into both incoming and outgoing wood.
The Destination Summary Report brings these movements together with forecast inventory and defined inventory targets. Users can see how inventory changes over time and compare forecast levels with minimum and maximum thresholds.
Comparing forecast inventory with minimum and maximum targets helps teams anticipate potential inventory issues and align incoming wood with destination requirements.
The report can also be filtered by attributes such as geography, destination, species, product, customer, and other available operational data.
Delivery Schedule
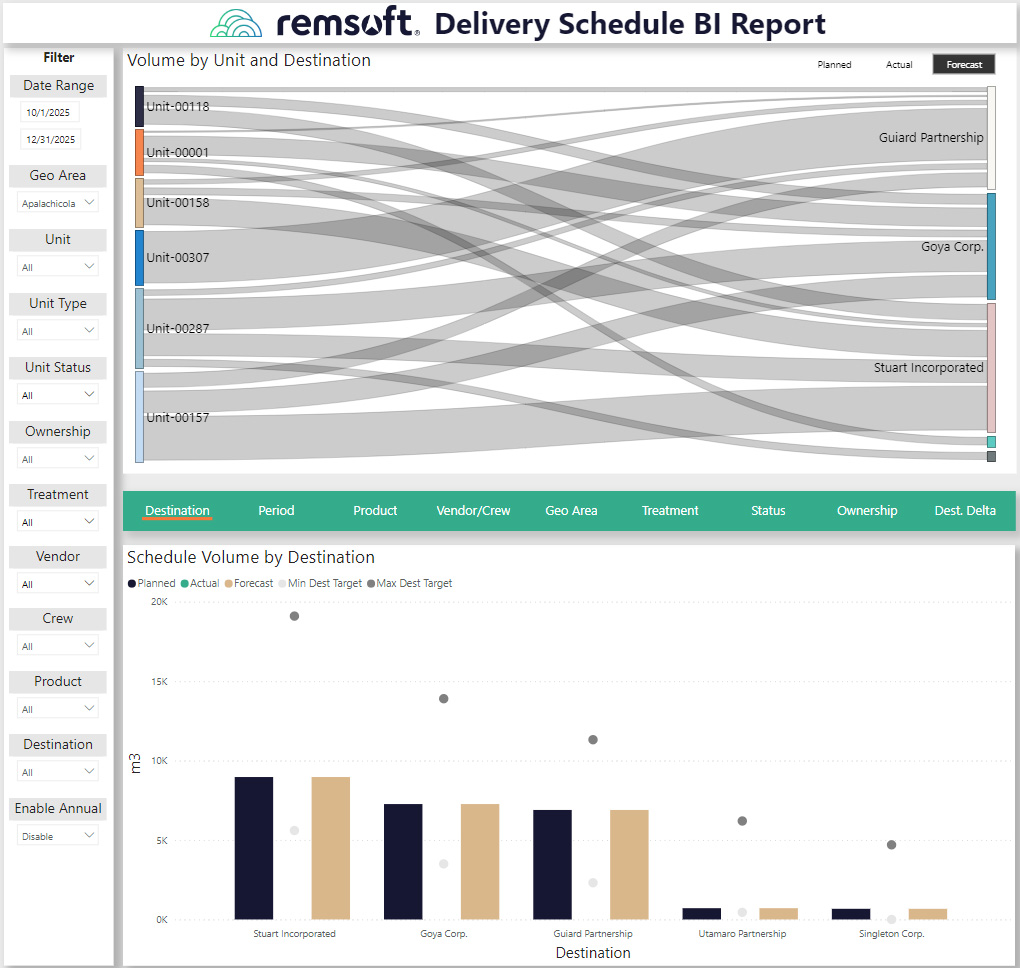
Delivery planning involves understanding not only how much wood is scheduled, but also where that volume is coming from and where it needs to go.
The Delivery Schedule BI Report provides a visual view of wood moving from individual harvest units to destinations. It also allows users to compare scheduled volumes across destinations and review them against planning targets.
Users can drill into the schedule by date, geographic area, unit, crew, product, destination, and other available attributes.
This makes it easier to see the relationship between harvest activity and delivery commitments without relying only on rows of scheduling data.
Remsoft Optimization Scenario Reporting
Related: Balancing Timber Revenue, Carbon, and ESG with Optimization Analytics.
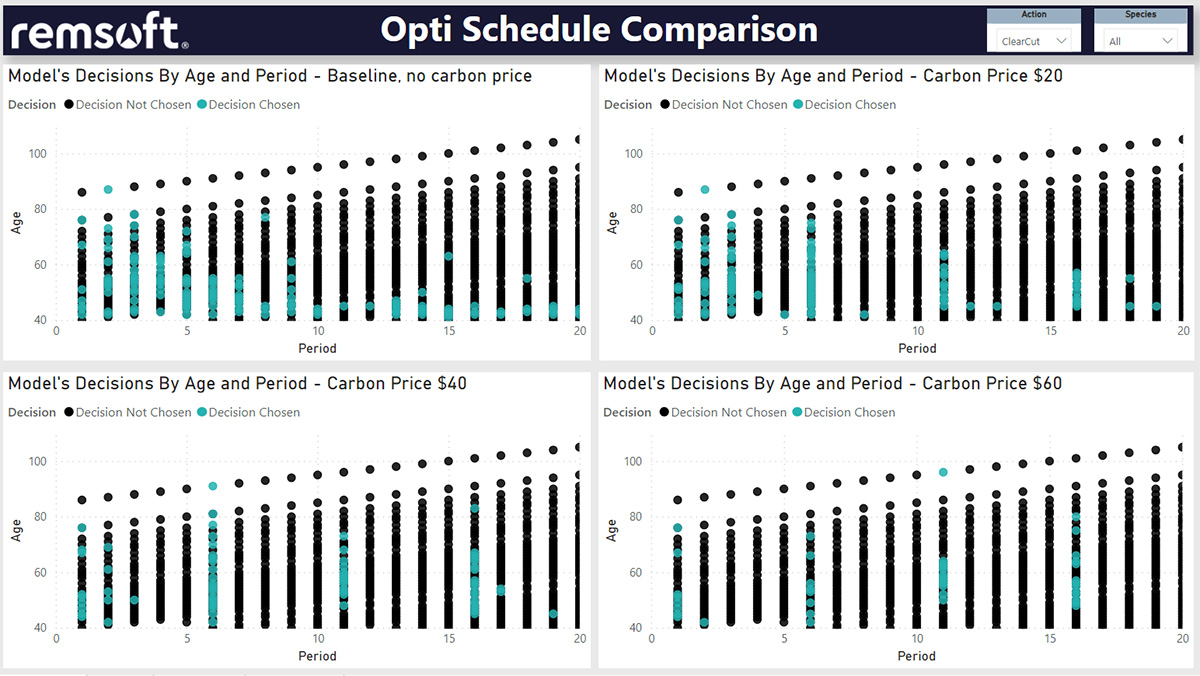
Power BI reporting can also be used to visualize outputs from Remsoft Optimization models.
One example compares optimization decisions under different carbon-price assumptions. The report displays a baseline with no carbon price alongside scenarios using carbon prices of $20, $40, and $60.
Selected and non-selected decisions can be viewed across the scenarios, making it easier to see how changing an assumption influences the optimization result.
This type of visualization can help planners interpret scenario analysis and communicate differences between alternative model runs more clearly.
Deployment and Use
Remsoft provides Power BI report templates that organizations can use as a starting point for their own reporting requirements.
Because Power BI supports configurable data visualization, teams can adapt existing templates or develop additional reports around the information, filters, and views that matter to their operation.
The important point is that reporting remains connected to the underlying forestry data. This allows planners and business users to explore operational information through familiar dashboards while maintaining a consistent source for planning and scheduling data.
Frequently Asked Questions
Remsoft BI Reporting can visualize operational and planning information such as wood flow, inventory, delivery schedules, planned versus actual performance, and outputs from optimization scenarios.
Yes. Power BI provides flexibility to adapt report layouts, filters, and visualizations around the information an organization needs to analyze.
Yes. Optimization outputs can be presented in Power BI to help users compare model decisions across different scenarios and assumptions.
Interactive reports make complex operational data easier to explore and interpret. Planners can compare performance, investigate specific areas, and understand how changes in data or planning assumptions affect the wider operation.
Turn Forest Operations Data Into Clearer Decisions
Forest operations planning depends on more than collecting data. Teams need to be able to understand that information quickly and use it when making decisions.
By connecting Remsoft planning and operational data with Power BI reporting, forestry organizations can gain clearer visibility into wood flow, inventory, deliveries, and planning scenarios.
Interactive data visualization makes it easier to move from rows of information to insights that planners and business users can explore, communicate, and use in their daily workflows.
See how Remsoft BI Reporting brings Power BI visibility to forest operations planning and scheduling.