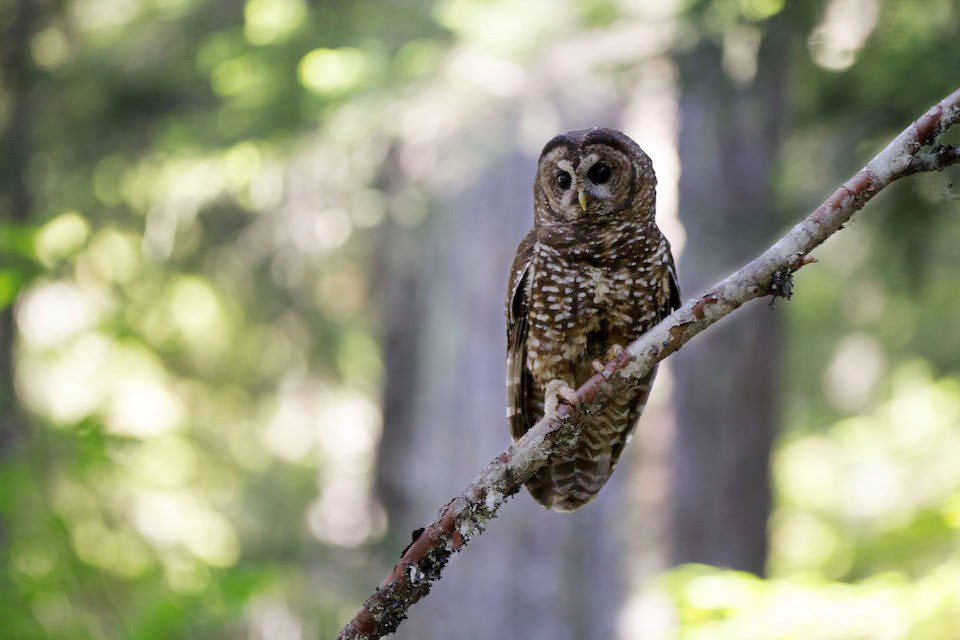

There are roughly 500 pairs of northern spotted owl remaining in Washington State. They are listed as threatened under the Endangered Species Act and preserving their territory is a challenge.
The owls are particularly sensitive to disturbances of their preferred habitat, the older forests with multiple layers of tree canopy found in Washington State. They can more easily perch, mate and forage in these complex structures where their primary food source, the northern flying squirrel, also tends to live.
A Delicate Balance
The Washington State Department of Natural Resources (DNR) manages five million acres of forests, farms, fisheries and commercial properties on behalf of the state, including this fragile owl habitat. The DNR has a legal duty to provide a flow of income from these assets to trust beneficiaries while honouring regulations to protect the environment and provide access for public use and recreation.
To generate income, the DNR sells timber harvest rights and leases land for agricultural production, communications sites and wind towers. Aquatic lands, including marine beds and beaches, are another source of revenue. Since 1970, these DNR-managed trust lands have generated $7.1 billion to support public schools, state universities and institutions, and county services. The steady income also helps the agency conserve habitats for fish and wildlife, provide a source of clean and abundant water, ensure public access, prevent and suppress forest fires, and regulate timber harvests and other activities.
It’s a delicate balancing act requiring consideration of a complex set of variables. To help manage this complexity, the DNR combines Esri data with Remsoft’s Woodstock Optimization Studio to create long-term sustainable management schedules using spatial data, growth and yield data and policy and procedure information as inputs. The forest software provides a holistic analysis of the forest by incorporating sustainability planning, conservation, harvesting and other variables into the model. The results can be viewed in tabular or graphical format or on a range of maps.
The Value of Visual
For example, one of the agency’s recent projects reviewed the northern spotted owl habitat. The review found that the forest near Mount Rainier was too dense for the owls, hindering their ability to fly between trees. Using Esri data and Remsoft Woodstock models, the DNR was able to demonstrate the benefits of selectively thinning the forest to give the owls more breathing room.
One of the main benefits of the Esri-Remsoft solution was the ability to communicate the forest plan spatially. By providing key stakeholders with high-level visuals of how the DNR’s proposal would affect outcomes, including the size of the habitat and revenue from harvests, consensus became easier to secure.
We can write pages and pages of reports, show table after table of data and talk for hours about the benefit of a particular decision, but when we show a map with how that decision will affect habitat, revenue or the forest, our stakeholders immediately understand the decision at hand,” said Angus Brodie, Assistant Division Manager, Washington State Department of Natural Resources.
“Stakeholders may not understand all of the science of modeling an owl habitat or the information that goes into an evaluation tool, but they do understand a visual map. It‘s much easier to win the confidence of people that what you‘re proposing to do is much better than what has been done in the past if you can display it visually.”
Better Habitat, Higher Revenue
After obtaining the necessary approvals from the U.S. Fish and Wildlife Service and the NOAA Fisheries Service, the DNR used Remsoft modelling to determine how field operation schedules could work within policy to maintain habitat.
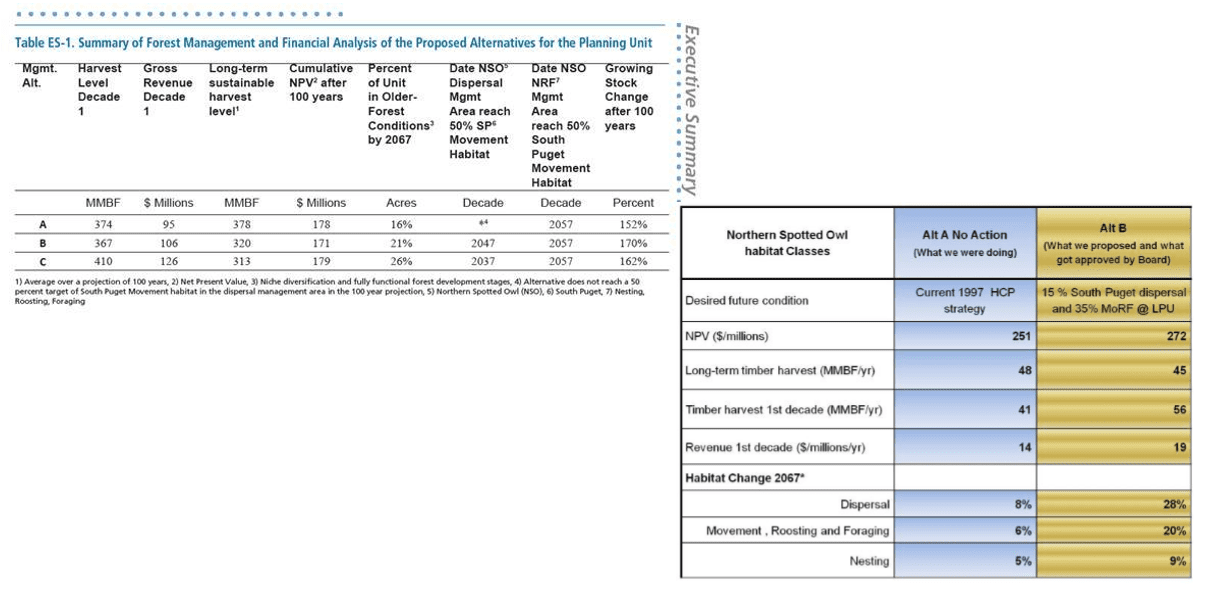
The breakthrough allowed the agency to create liveable owl habitat while continuing to meet its fiduciary responsibility to beneficiaries. Through a combination of thinning and final rotation harvests for the overly dense forest, the DNR increased spotted owl habitat by 28%, Net Present Value of the forest by 8%, and the immediate revenue from harvesting.
Managing complex assets, requirements and demands
Using Woodstock Optimization Studio, Washington State DNR was able to create models that enable the best possible land management choices, based on the Esri spatial data, growth and yield information and policy and procedure constraints.
Specifically, Washington State DNR uses Esri‘s ArcGIS and Remsoft‘s Woodstock to understand the spatial relationships of its assets, particularly the forest assets. This holistic approach answers questions such as: What is going to be harvested and where? Are there sensitive resource areas located near a proposed harvest site? What areas are designated as dispersal habitat for the northern spotted owl?
With more than one million records in Washington State DNR‘s GIS, and various DNR policies and external regulations, Washington State DNR builds models for planning and scheduling so that many considerations can be incorporated into the decision-making process.